Did you know that usage of visual information on the internet has increased by 9900% since 2007? Visual content seems to be everywhere around us and the data shows that it’s not going away anytime soon.
What’s more, in the article below you’ll see more proof of how interest in visual content strategies is rising like never before.
I believe these visual content marketing statistics hold valuable lessons for any marketer who wants to keep up with the trends.
Let’s get you informed!
The Growing Impact of Visual Content Marketing Through Stats
2019 saw an explosion of visual content.
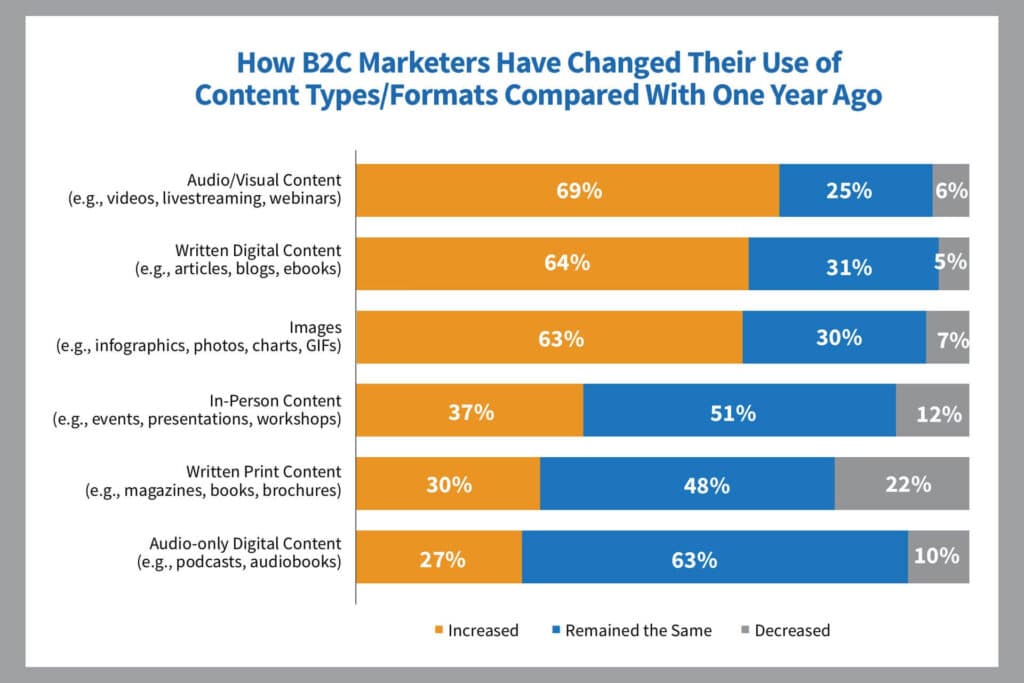
The majority of B2C content marketers increased their use of audio/visual content, written digital content, and images compared with one year ago. Image source: Content Marketing Institute.
Marketers not only produced more visual content but were also eager to learn more about the types of visual content that offer the best ROI in order to stay competitive.
- 88% of marketers stated that that they incorporated visual content in more than 50% of all the articles they published. (Source)
- 37% of all interviewed marketers stated that they spend 2–5 hours a week creating and producing visual content. (Source)
- 32% of all interviewed marketers said that they plan to invest 30% of their budget on creating visual content. (Source)
- The majority of B2C marketers have increased their usage of audio and visual content. (Source)
Visual Content Marketing Stats: Images
Did you know that in 2017 people took an estimated 1.2 trillion digital photos?
Marketers are in on this trend too.
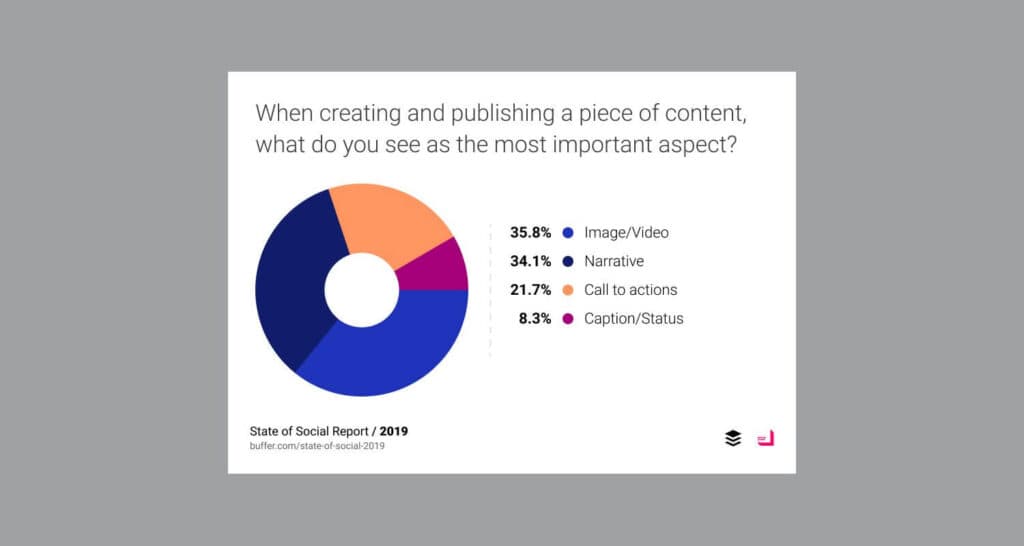
Image source: Buffer.
Let’s delve a little deeper and see what we can learn from the most recent statistics.
- 42% of marketers stated that stock photography is the most frequently used visual content by their brands. (Source)
- In their Social Media Report for 2019, Buffer found that for marketers, images and videos are the most important types of content they produce. (Source)
- The majority of B2C marketers have increased their usage of audio and visual content. (Source)
- Images are the most important type of visual content for 32% of marketers interviewed in 2023. (Source)
- 68% of marketers reported that they plan to increase the use of visuals in their marketing campaigns. (Source)
- Images are the most frequently used type of visual content for marketing campaigns (80%) followed by video (63%). (Source)
Visual Content Marketing Stats: Video
Video is big right now! The word “video” is the fourth biggest global query after Facebook, YouTube, and Google.
What’s more, there’s been a 30% increase in Google searches for the word “video” over the past year.
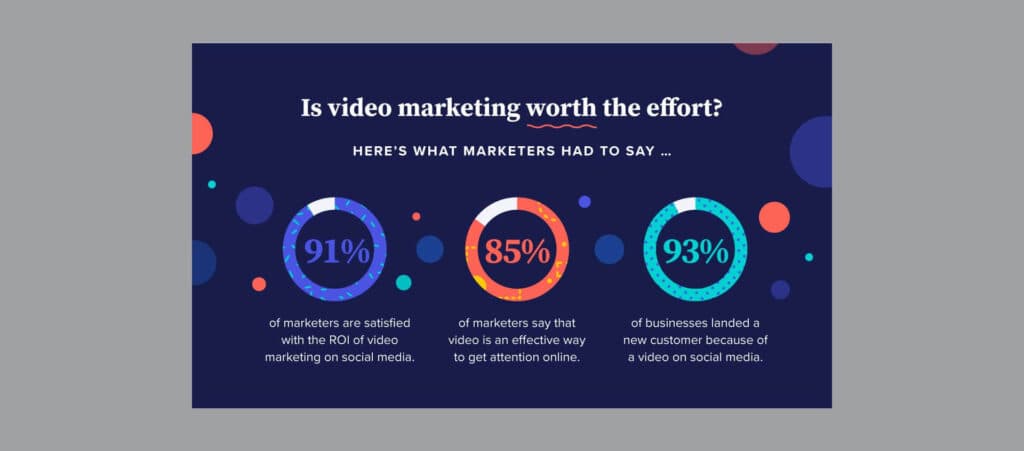
Image source: Animoto.
In the paragraph below, you’ll learn why video is currently the most popular type of visual content and why incorporating videos in your marketing campaigns is an absolute must.
- 80% of all internet traffic will be video by 2020. (Source)
- 52% of surveyed marketers stated that they used or developed video snippets in 2019. (Source)
- Over 50% of consumers watch product videos before they make a purchasing decision. (Source)
- In their State of Social 2019 Report, Buffer found that 36.7% of businesses are publishing video content monthly and 24.3% weekly, while just 14.5% of businesses don’t publish video content at all. (Source)
- 64% of marketers reported that they landed a new customer by posting a video in the last 12 months. (Source)
- 70% of marketers say that they’ve increased the number of videos they create compared to last year. (Source)
- Video is the number one form content marketers want to learn more about. (Source)
- 73% of surveyed marketers said that they plan to increase the usage of video in the years to come. (Source)
- Videos are a big hit on Twitter. In fact videos are 6x more likely to be retweeted than photos. (Source)
- Video content is 3x times more likely to be retweeted than gifs on Twitter. (Source)
- Twitter is the best platform for “coming across videos.” (Source)
Facebook Stats
- Facebook’s survey found that people under 45 are more likely to watch video content on mobile devices. (Source)
- A video posted on Facebook receives 135% more organic reach than an image posted on Facebook. (Source)
- Viewers gaze 5x time longer at video content than at other types of content on Facebook and Instagram. (Source)
- Animoto’s Social Media Trends Report for 2020 showed that 91% of the interviewed marketers are satisfied with the ROI of their video marketing campaigns. (Source)
YouTube Video
- 47% of surveyed video marketers reported that they’ve used YouTube as a marketing channel. 88% of them said it worked well for them and 80% of them intend to keep on using the platform and as a channel. (Source)
Instagram Video
- 51% of surveyed video marketers reported that they’ve used Instagram video as a marketing channel. 88% of them said it worked well for them and 67% intend to keep on using the platform. (Source)
Snapchat
- 12% of surveyed video marketers reported that they’ve used Snapchat as a marketing channel. 50% of them said it worked well for them and 10% intend to keep on using Snapchat as a channel. (Source)
Live Video Stats
Live video is becoming a big trend among brands and surveys show (Cisco) that this trend shows no sign of stopping.
Social media giants are also excited about this topic, with Mark Zuckerberg pushing Facebook toward live videos and stating that he is excited about the future of this format.
- Live video accounts for 5% of internet video traffic and is expected to reach 17% by 2022. (Source)
- 35% of surveyed video marketers reported that they’ve used Facebook Live as a marketing channel. 74% of them said it worked well for them and 36% plan to keep on using the platform as a channel. (Source)
- B2C marketers have shown a bigger interest in learning about live videos (71%) than B2B marketers (63%). (Source)
- The usage of live videos by marketers on social media platforms has increased to 35% compared to 28% in 2023. (Source)
- 42.7% of businesses have broadcast live videos in 2019. (Source)
Visual Content Marketing Stats: Infographics
Infographics are visually compelling representations that allow marketers to explain complex information. As our collective attention span is decreasing, infographics seem to be an appealing way to grab audiences’ attention.
- In 2024, original infographics drove more engagement than other types of visual content. (Source)
- 65% of B2B marketers use infographics in their marketing campaigns. (Source)
- A survey by NeoMam found that people who follow instructions that contain both text and visuals do 323% better than those following instructions without illustrations. (Source)
Visual Content Marketing Stats: Social Media
In 2017, there were 2.48bn active social media users. Social media platforms are also shaping the future of digital marketing. Let’s see which types of visual content make a difference on social media giants.
- Videos posted on Instagram get 21.1% more interactions than images. (Source)
- The top platform for watching videos after YouTube is Facebook. (Source)
- Buffer’s Social Media Report for 2019 showed that 81.2% of businesses share video content on Facebook, followed by YouTube (62%) and Instagram (57.8%).
- 91% of interviewed marketers said that investing in video marketing on social media paid off for them. 85% of marketers find posting videos on social media platforms a successful way of gaining an audience online. 93% of businesses had gained a new customer by posting videos on social media platforms. (Source)
- 93% of businesses post a video on Facebook once a week or more. (Source)
- One billion hours of YouTube videos are consumed daily. (Source)
- 70% of videos on YouTube are watched on mobile devices. (Source)
Trends to Keep Your Eye On
It’s clear – tailoring authentic copy for your marketing campaign just won’t cut it in a digital age where 81% of people only skim the content they read online. The stats above show that learning about and investing in visual content has proved itself a successful way to catch and retain customers’ attention.
Now, let’s briefly recap the main takeaways.
Invest in Infographics
Infographics represent a useful and impactful way to communicate with your audience and bring them closer to complex data. The search volume for the words “infographic” and “infographics” has increased by 800% since 2000 and, as we mentioned above, original infographics drove more engagement than other visual content in 2018.
Focus on Video and Live
It’s expected that the video marketing industry will only grow in the coming years. Video marketing made nearly $28 billion in revenue in 2018, and the numbers are expected to keep on growing and reach $47 billion in revenue by 2024. (Source)
It’s safe to say that no marketer can afford to neglect video as a medium for raising brand awareness, generating leads, getting more engagement, and educating their audience.
You Can’t Afford to Neglect Visual Content, Period
Whatever you do, try to make visuals the focus of your strategies – they should never come as an afterthought. Infographics and video are now on the rise, but things are constantly evolving in the world of marketing. So keep track of visual content marketing statistics so that new trends won’t catch you by surprise.
And one last stat on visual marketing. Did you know that 95% of marketers have a separate visual content marketing strategy?