Lean Analytics Summary (Review & Book Notes)
The best book about analytics for startup that you’ll ever read. I can’t recommend it highly enough for tech entrepreneurs.
Updated 51 min read
The best book about analytics for startup that you’ll ever read. I can’t recommend it highly enough for tech entrepreneurs.
The best book about analytics for startup that you’ll ever read. I can’t recommend it highly enough for the tech entrepreneur that needs help measuring and improving his startup’s metrics.
Authors: Alistair Croll, Benjamin Yoskovitz
Originally published: 2013
Pages: 440
Genre: Business
Goodreads rating: ⭐️ 4.09/5
👉 Buy Lean Analytics on Amazon
🎧 Listen for free on Everand (plus 1+ million other books)
Analytics is about tracking the metrics that are critical to your business. Usually, those metrics matter because they relate to your business model— where money comes from, how much things cost, how many customers you have, and the effectiveness of your customer acquisition strategies.
In a startup, you don’t always know which metrics are key, because you’re not entirely sure what business you’re in. You’re frequently changing the activity you analyze. You’re still trying to find the right product, or the right target audience. In a startup, the purpose of analytics is to find your way to the right product and market before the money runs out.
Here are some rules of thumb for what makes a good metric—a number that will drive the changes you’re looking for.
A good metric is comparative. Being able to compare a metric to other time periods, groups of users, or competitors helps you understand which way things are moving. “Increased conversion from last week” is more meaningful than “2% conversion.”
A good metric is understandable. If people can’t remember it and discuss it, it’s much harder to turn a change in the data into a change in the culture.
A good metric is a ratio or a rate. Accountants and financial analysts have several ratios they look at to understand, at a glance, the fundamental health of a company.* You need some, too.
A good metric changes the way you behave. This is by far the most important criterion for a metric: what will you do differently based on changes in the metric?
Drawing a line in the sand is a great way to enforce a disciplined approach. A good metric changes the way you behave precisely because it’s aligned to your goals of keeping users, encouraging word of mouth, acquiring customers efficiently, or generating revenue.
If you want to change behavior, your metric must be tied to the behavioral change you want. If you measure something and it’s not attached to a goal, in turn changing your behavior, you’re wasting your time. Worse, you may be lying to yourself and fooling yourself into believing that everything is OK. That’s no way to succeed.
Segmentation
A segment is simply a group that shares some common characteristic. It might be users who run Firefox, or restaurant patrons who make reservations rather than walking in, or passengers who buy first-class tickets, or parents who drive minivans.
On websites, you segment visitors according to a range of technical and demographic information, then compare one segment to another. If visitors using the Firefox browser have significantly fewer purchases, do additional testing to find out why. If a disproportionate number of engaged users are coming from Australia, survey them to discover why, and then try to replicate that success in other markets.
Cohort Analysis
A second kind of analysis, which compares similar groups over time, is cohort analysis. As you build and test your product, you’ll iterate constantly. Users who join you in the first week will have a different experience from those who join later on. For example, all of your users might go through an initial free trial, usage, payment, and abandonment cycle. As this happens, you’ll make changes to your business model. The users who experienced the trial in month one will have a different onboarding experience from those who experience it in month five. How did that affect their churn? To find out, we use cohort analysis.
Each group of users is a cohort—participants in an experiment across their lifecycle. You can compare cohorts against one another to see if, on the whole, key metrics are getting better over time.
A/B and Multivariate Testing
When we’re comparing one attribute of a subject’s experience, such as link color, and assuming everything else is equal, we’re doing A/B testing.
You can test everything about your product, but it’s best to focus on the critical steps and assumptions.
Rather than running a series of separate tests one after the other—which will delay your learning cycle—you can analyze them all at once usinga technique called multivariate analysis. This relies on statistical analysis of the results to see which of many factors correlates strongly with an improvement in a key metric.
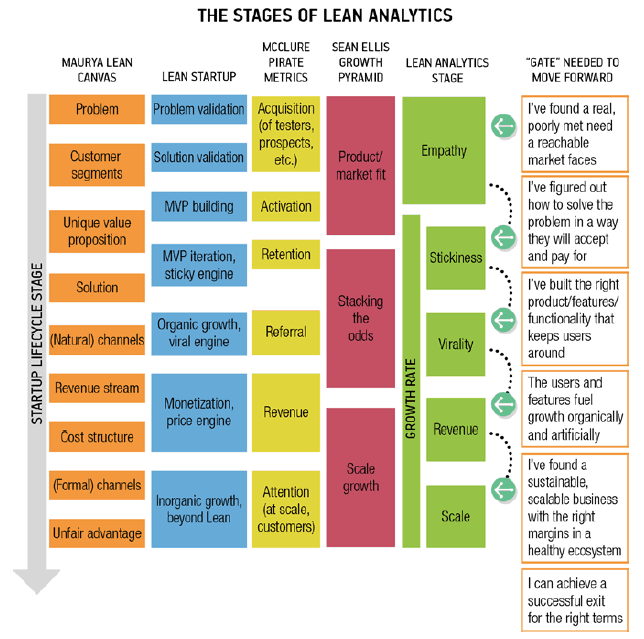
Having reviewed these frameworks, we needed a model that identified the distinct stages a startup usually goes through, and what the “gating” metrics should be that indicate it’s time to move to the next stage. The five stages we identified are Empathy, Stickiness, Virality, Revenue, and Scale.
Ultimately, there are a number of good frameworks that help you think about your business.
Knowing which metric to focus on isn’t enough. You need to draw a line in the sand as well. Let’s say that you’ve decided “New Customers Per Week” is the right metric to focus on because you’re testing out new ways of acquiring customers. That’s fair, but it doesn’t answer the real question: How many new customers per week do you need? Or more specifically: How many new customers per week (per acquisition channel) do you think defines a level of success that enables you to double down on user acquisition and move to the next step in the process?
You need to pick a number, set it as the target, and have enough confidence that if you hit it, you consider it success. And if you don’t hit the target, you need to go back to the drawing board and try again.
Picking the target number for any given metric is extremely hard. We’ve seen many startups struggle with this. Often, they avoid picking a number altogether. Unfortunately, this means it’s difficult to know what to do once an experiment is completed. If, in our example, the user acquisition experiment is a dismal failure, any number you had picked beforehand is probably immaterial; you’ll know it’s a failure. And if your efforts are insanely successful, you’re going to know that as well. It’ll be obvious. But most of the time, experiments end up right in the big fat middle. There was some success, but it wasn’t out of this world. Was it enough success to keep going, or do you have to go back and run some new experiments? That’s the trickiest spot to be in.
There are two right answers to the question of what success looks like. The first comes from your business model, which may tell you what a metric has to be. If you know that you need 10% of your users to sign up for the paid version of your site in order to meet your business targets, then that’s your number.
The second right answer is to look at what’s normal or ideal. Knowing an industry baseline means you know what’s likely to happen, and you can compare yourself to it. In the absence of any other information, this is a good place to start.
To decide which metrics you should track, you need to be able to describe your business model in no more complex a manner than a lemonade stand’s. You need to step back, ignore all the details, and just think about the really big components.
Business growth comes from improving one of these five “knobs”:
When you get a wave of visibility, few of the resulting visitors will actually engage with your product. Many are just driving by.
The key here is analytics. You need to segment real, valuable users from drive-by, curious, or detrimental ones. Then you need to make changes that maximize the real users and weed out the bad ones.
Segmenting real users from casual ones also depends on how much effort your users have to put into using the application.
As a startup, you have a wide range of payment and incentive models from which to choose: freemium, free trial, pay up-front, discount, ad-funded, and so on. Your choice needs to match the kind of segmentation you’re doing, the time it takes for a user to become a paying customer, how easy it is to use your service, and how costly an additional drive-by user is to the business.
Not all customers are good. Don’t fall victim to customer counting. Instead, optimize for good customers and segment your activities based on the kinds of customer those activities attract.
Consider an online luxury goods store. Subscribers to the site get exclusive deals at reduced prices for items that are curated by the site’s operators. Visitors to the site can browse what’s available, but must sign up to place an order or put something in a shopping cart; by signing up, they agree to receive a daily email update. Visitors can also tweet or like something they see on the site.
The company cares about several key metrics:
Conversion Rate
Conversion rate is simply the percentage of visitors to your site who buy something. It’s one of the first metrics you use to assess how you’re doing. It’s simple to calculate and experiment with. You’ll slice conversion rate in many ways—by demographics, by copy, by referral, and so on—to see what makes people more likely to buy.
Early on, conversion rate may even be more important than total revenue because your initial goal is to simply prove that someone will buy something (and it gives you that person’s email address and data on what he purchases). But there’s also a risk in focusing too intensely on conversion rate. Conversion rate is highly dependent on your type of e-commerce business, and whether your success will be driven by loyalty, new customer acquisition, or a hybrid of the two.
Purchases Per Year
If you look at the repurchase rate on a 90-day cycle, it becomes a very good leading indicator for what type of e-commerce site you have. There’s no right or wrong answer, but it is important to know whether to focus more on loyalty or more on acquisition.
Shopping Cart Size
The other half of the conversion rate equation is the size of the shopping cart. Not only do you want to know what percentage of people bought something, you also want to know how much they spent. You may find that one campaign is more likely to make people buy, but another might make fewer people spend more money.
In practice, you’ll compare the total revenue you’re generating to the way in which you acquired that revenue, in order to identify the most lucrative segments of your reachable audience. But don’t get too caught up in top-line revenue; profit is what really matters.
The key to successful e-commerce is in increasing shopping cart size; that’s really where the money is made. I like to think of customer acquisition cost as a fixed cost, so any increase in order size is expanding your margin.
Abandonment
The number of people who abandon a funnel at each of these stages is the abandonment rate. It’s important to analyze it for each step in order to see which parts of the process are hurting you the most. In some cases, this may be a particular form field—for example, asking people for their nationality could be alienating buyers. Tools like ClickTale perform abandonment analysis within the form itself, making it easier to pinpoint bottlenecks in the conversion process where you’re losing customers.
Cost of Customer Acquisition
Accounting for the cost of acquisition in aggregate is fairly easy; it’s more complicated when you have myriad channels driving traffic to your site. The good news is that analytics tools were literally built to do this for you. The reason Google has a free analytics product is because the company makes money from relevant advertising, and wants to make it as easy as possible for you to buy ads and measure their effectiveness.
Revenue Per Customer
Revenue per customer (or lifetime value) is important for all types of e-commerce businesses, regardless of whether you’re focused on new customer acquisition or loyalty (or both). Even if your business doesn’t engender loyalty (because you’re selling something that’s infrequently purchased), you want to maximize revenue per customer; you do so by increasing shopping cart size and conversion while reducing abandonment. Revenue per customer is really an aggregate metric of other key numbers, and represents a good, single measure of your e-commerce business’s health.
Keywords and Search Terms
Most people find products by searching for them, whether that’s in a web browser, on a search engine, or within a site. In each case, you want to know which keywords drive traffic that turns into money.
For paid search, you’re going to be bidding against others for popular keywords in search engines like Google. Understanding which words are a comparatively good “value”—not too expensive, but still able to drive a reasonable amount of traffic—is what search engine marketing professionals do for a living.
For unpaid search, you’ll be more focused on good, compelling content that improves your ranking with search engines, and on writing copy that includes the desirable search terms your paying customers tend to use (so you’ll be featured in search results because of your relevance).
You also want to analyze search within your site. First, you want to be sure you have what people are after. If users are searching for something and not finding it—or searching, then pressing the back button—that’s a sign that you don’t have what they want. Second, if a significant chunk of searches fall into a particular category, that’s a sign that you might want to alter your positioning, or add that category to the home page, to see if you can capture more of that market faster.
Recommendation Acceptance Rate
There are many different approaches to recommendations. Some use what the buyer has purchased in the past; others try to predict purchases from visitor attributes like geography, referral, or what the visitor has clicked so far. Predictive analysis of visitors relies heavily on machine learning, and the metrics you’ll track will vary from tool to tool, but they all boil down to one thing: how much additional revenue am I generating through recommendations?
Virality
For many e-commerce sites, virality is important, because referral and viral attention drives cheap, high-value traffic. It has the lowest cost of customer acquisition and the highest implied recommendation from someone the recipient trusts.
Mailing List Click-Through Rates
You calculate the email click-through rate by dividing the number of visits you get from a campaign by the number of messages you’ve sent. A more sophisticated analysis of email click-through rate will include a breakdown of the various places where things can go wrong—for example, what percentage of email addresses didn’t work anymore—and a look at the eventual outcome you’re after (such as a purchase).
You also need to create a campaign contribution metric—basically, the added revenue from the campaign, minus the cost of the campaign and the loss due to unsubscribes. The good news is that most email platforms include this data with minimal effort.
Consider a project management startup that lets users try its product, but charges for more than three concurrent projects. It offers four tiers: free, 10 projects, 100 projects, and unlimited. It runs ads on several platforms to attract users to its site, and each time a user invites someone else to join a project, that person becomes a user.
The company cares about the following key metrics:
Describing a customer lifecycle in this way is a good method for understanding the key metrics that drive your business. This is where Lean Startup helps. You need to know which aspects of your business are too risky and then work to improve the metric that represents that risk.
You have to know where the risk is, but focus, in the right order, on just enough optimization to get the business to a place where that risk can be quantified and understood.
The ultimate metric for engagement is daily use. How many of your customers use your product on a daily basis? If your product isn’t a daily use app, establishing a minimum baseline of engagement takes longer, and the time it takes to iterate through a cycle of learning is longer. It’s also hard to demonstrate enough value, quickly enough, to keep people from churning. Habits are hard to form—and with any new product, you’re creating new habits, which you want to do as quickly and intensely as possible.
There is an important lesson around business models and Lean Startup—you bring an early version of your product to the market, test its usage, and look for where it’s got the highest engagement among your customers. If there’s a subsection of users who are hooked on your product—your early adopters—figure out what’s common to them, refocus on their needs, and grow from there. Claim your beachhead. It will allow you to iterate much more quickly on a highly engaged segment of the market.
Some applications simply aren’t meant to be used on a daily basis. But you still need to set a high bar for engagement and measure against it. It’s critical that you understand customers’ behavior, and draw lines in the sand appropriate to that. Perhaps the goal is weekly or monthly use.
If you’re building something genuinely disruptive, you need to consider the technology adoption lifecycle, from early to mainstream.
When measuring engagement, don’t just look at a coarse metric like visit frequency. Look for usage patterns throughout your application. For example, it’s interesting to know that people log in three times per week, but what are they actually doing inside your application? What if they’re only spending a few minutes each time? Is that good or bad? Are there specific features they’re using versus others? Is there one feature that they always use, and are there others they never touch? Did they return of their own accord, or in response to an email?
Finding these engagement patterns means analyzing data in two ways:
A data-driven approach to measuring engagement should show you not only how sticky your product or service is, but also who stuck and whether your efforts are paying off.
Churn is the percentage of people who abandon your service over time. This can be measured weekly, monthly, quarterly, etc., but you should pick a timespan for all your metrics and stick to it in order to make comparing them easier. While churn might seem like a simple metric, there are a number of complications that can make it misleading, particularly for companies that have a highly variable growth rate.
Unpaid users “churn” by cancelling their accounts or simply not coming back; paid users churn by cancelling their accounts, stopping their payments, or reverting to an unpaid version. We recommend defining an inactive user as someone who hasn’t logged in within 90 days (or less). At that point, they’ve churned out; in an always-connected world, 90 days is an eternity.
Because the number of churns in a particular period is affected by the entire period, but the number of customers at the beginning of a period is a moment-in-time snapshot, calculating churn in this simple manner can give misleading results in startups where growth is varied or unusually fast. In other words, churn isn’t normalized for behavior and size—you can get different churn rates for the same kind of user behavior if you’re not careful.
To fix this, you need to calculate churn in a less simple, but more accurate, way: average out the number of customers in the period you’re analyzing, so you’re not just looking at how many you had at the beginning:
Ultimately, the math gets really complex. There are two ways to simplify it. The first is to measure churn by cohort, so you’re comparing new to churned users based on when they first became users. The second way is really, really simple, which is why we like it: measure churn each day. The shorter the time period you measure, the less that changes during that specific period will distort things.
In a SaaS model, most of the complexity comes from two things: the promotional approach you choose, and pricing tiers.
As we’ve seen, some SaaS companies use a freemium model to convince people to use the service, and then make money when those users exceed some kind of cap. A second approach is a free trial, which converts to a paid subscription if the customer doesn’t explicitly cancel after a certain time. A third approach is paid-only. There are others. Each has its benefits and drawbacks—paid-only controls cost, is more predictable, and gives you an immediate idea of whether your offering is valuable; freemium allows you to learn how people are using your service and builds goodwill. The difference between these user groups can complicate analysis.
The second wrinkle comes from how you tier pricing. Since different customers have different levels of consumption, the price they pay may change over time. This means you’re constantly trying to upsell users to bigger tiers, and predicting growth adds to the dimensions of a model, making it harder to predict and explain your business.
Mobile app developers make money within their applications in several ways:
The most obvious metric for a media site is audience size. If we assume that an ad will get industry-standard click-through rates, then the more people who visit your site, the more money you’ll make.
Tracking the growth in audience size—usually measured as the number of unique visitors a month—is essential.
You can calculate audience churn on a media site by looking at the change in unique visitors in a specific month and the number of new visitors that month.
Tracking unique visitors is a good start, but you need to measure ad inventory as well. This is the total number of unique page views in a given period of time, since each page view is a chance to show a visitor an ad. You can estimate inventory from visitors and pages per visit, but most analytics packages show the number automatically.
The rate advertising networks will pay you for an ad depends on your content and the going rate for a particular search term or keyword. For a straight-up media site, the ad rate is driven by the topic of your site and the content you publish. For a social network, the demographics of your audience drive ad rates.
The big decision any media site makes is how to pay the bills without selling out. This manifests itself in two ways. First, ad space: too many ads leads to lousy content and reduced visitor loyalty. Second, content: if your content is written to attract lucrative ad keywords, it’ll feel forced and seem like a paid promotion.
If you’re serious about content, you need to test different layouts for revenue-versus-churn, and different copy for content-versus-ad-value.
There are commercial tools to help with this. Parse.ly, for example, tries to analyze which content is getting the most traction. You might also segment key metrics like revenue or percentage of visitors who exit on a particular page by author, topic, or layout.
A UGC site is successful when its visitors become regulars. We look at recency to understand this—that is, when was the last time someone came back to the site? One quick way to measure this is the day-to-week ratio: how many of today’s visitors were here earlier in the week? It’s an indicator of whether people are returning on a regular basis, even if users don’t create an account.
Another metric is the average days since last visit, although you need to exclude users who are beyond some cutoff limit (such as 30 days) from this calculation; otherwise, churned users will skew your numbers. For users who have accounts and take actions, you can measure engagement in other ways: days since last post, number of votes per day, and so on.
The content your users create has a value. That might be the number of unique visitors who see it (in the case of a site like Wikipedia), the number of page views that represent ad inventory (Facebook), or a more complicated measurement like affiliate revenues generated by clicks on content users post (as in the Pinterest affiliate model).
Regardless of how you value content, you’ll want to measure it by cohort or traffic segment. If you’re trying to decide where to invest in visitor acquisition, you’ll want to know which referring sites bring valuable users.
A UGC site thrives on its visitors’ behavior, and key among those behaviors is sharing.
While tweeting and liking content is useful, remember that a lot of sharing happens through other systems—RSS feeds and email, in particular. In fact Tynt, which makes tools for publishers to tag sharing when a link is copied and pasted, estimates that as much as 80% of sharing happens through email.
In a marketplace, the company makes money when a buyer and seller come together to complete a transaction.
A marketplace includes a shared inventory model and two stakeholders—buyers and sellers, creators and supporters, prospective partners, or hotels and travellers. They all make money when the two stakeholders come together, and they often differentiate based on a particular set of search parameters or qualifications (e.g., apartments that have been vetted, seller ratings). And they all need an inventory to get started.
We’re going to define two-sided marketplaces more narrowly. In our definition:
Two-sided marketplaces face a unique problem: they have to attract both buyers and sellers. That looks like twice as much work. Companies like DuProprio/Comfree, Etsy, Uber, and Amazon found ways around this dilemma, but they all boil down to one thing: focus on whomever has the money. Usually, that’s buyers: if you can find a group that wants to spend money, it’s easy to find a group that wants to make money.
Imagine you’re launching a two-sided marketplace for secondhand game consoles. Those with a console to sell can list it, and those looking for a console to buy can browse by a variety of criteria. The transactions are handled through PayPal, and you retain a portion of the proceeds above a minimum amount.
Because you’re not a vendor of consoles yourself, you need to find a way to produce either an inventory of consoles, or a large group of customers. You need to pick which side of the market you’re going to “seed.”
If you want to seed the seller side, you might crawl Craigslist and approach console owners to see if they have inventory, encouraging them to list items. If you want to seed the buyer side, you might set up a forum for nostalgic game players, bringing them together and inviting them from social sites.
You could create an artificial inventory by selling consoles to start with, and then gradually adding inventory from others.
On the other hand, if you want to seed the buyer side, you probably need to pick something for which you can command an initial inventory, then purchase some; or you might take orders with a promise of fulfilling them later, knowing you have access to that inventory.
The first step of a two-sided marketplace—and the first thing to measure—is your ability to create an inventory (supply) or an audience (demand). The metrics you’ll care about first are around the attraction, engagement, and growth of this seed group.
Josh Breinlinger, a venture capitalist at Sigma West who previously ran marketing at labor marketplace oDesk, breaks up the key marketplace metrics into three categories: buyer activity, seller activity, and transactions. “I almost always recommend modeling the buyer side as your primary focus, and then you model supply, more in the sense of total inventory,” he says. “It’s easy to find people that want to make money; it’s much harder to find people that want to spend money.”
Josh cautions that just tracking buyer, seller, and inventory numbers isn’t enough: you have to be sure those numbers relate to the actual activity that’s at the core of your business model.
Once you’ve got both sides of the market together, your attention (and analytics) will shift to maximizing the proceeds from the market—the number of listings, the quality of buyers and sellers, the percentage of searches for which you have at least one item in inventory, the marketplace specificmetrics Josh mentions, and ultimately, the sales volume and resulting revenue. You’ll also focus on understanding what makes a listing desirable so you can attract more like it. And you’ll start tracking fraud and bad offerings that can undermine the quality of the marketplace and send buyers and sellers away.
This metric is particularly important in the early stages of the business. If you’re competing with others, then your line in the sand is an inventory of sellers that’s comparable to that of your competitors, so it’s worth a buyer’s time to search you. If you’re in a relatively unique market, then your line in the sand is enough inventory that buyers’ searches are returning one or more valid results.
In addition to sellers, you need to track listings they create. Focus on the number of listings per seller and whether that’s growing, as well as the completeness of those listings (are sellers completing the description of their offering?).
A bigger inventory means more searches are likely to yield results. If you start to saturate your marketplace (i.e., if most of the sellers in your market have already become members), then your growth will come from increasing their listings and the effectiveness of those listings.
In many two-sided markets, searches are the primary way in which buyers find sellers. You need to track the number of searches that return no results—this is a lost sales opportunity.
You should also look at the search terms themselves. By looking at the most common search terms that yield nothing, you’ll find out what your buyers are after.
Every startup goes through stages, beginning with problem discovery, then building something, then finding out if what was built is good enough, then spreading the word and collecting money. These stages—Empathy, Stickiness, Virality, Revenue, and Scale—closely mirror what other Lean Startup advocates advise.
In the Empathy stage, your focus is on gathering qualitative feedback, primarily through problem and solution interviews. Your goal is to find a problem worth solving and a solution that’s sufficiently good to garner early traction. You’re collecting this information by getting out of the building. If you haven’t gotten out of the building enough—and spoken to at least 15 people at each interviewing stage—you should be very concerned about rushing ahead.
Early on, you’ll keep copious notes. Later, you might score the interviews to keep track of which needs and solutions were of the greatest interest, because this will tell you what features need to be in your minimum viable product (MVP).
Qualitative metrics are all about trends. You’re trying to tease out the truth by identifying patterns in people’s feedback. You have to be an exceptionally good listener, at once empathetic and dispassionate. You have to be a great detective, chasing the “red threads” of the underlying narrative, the commonalities between multiple interviewees that suggest the right direction. Ultimately, those patterns become the things you test quantitatively, at scale. You’re looking for hypotheses.
The reality of qualitative metrics is that they turn wild hunches—your gut instinct, that nagging feeling in the back of your mind—into educated guesses you can run with. Unfortunately, because they’re subjective and gathered interactively, qualitative metrics are the ones that are easiest to fake.
While quantitative metrics can be wrong, they don’t lie. You might be collecting the wrong numbers, making statistical errors, or misinterpreting the results, but the raw data itself is right. Qualitative metrics are notoriously easy for you to bias. If you’re not ruthlessly honest, you’ll hear what you want to hear in interviews. We love to believe what we already believe— and our subjects love to agree with us.
A simple approach is to score your problem interviews. This is not perfectly scientific; your scoring will be somewhat arbitrary, but if you have someone assisting you during the interviews and taking good notes it should be possible to score things consistently and get value out of this exercise.
For the purposes of scoring the interview and measuring pain, a bad score means the interview is a failure—the interviewee’s pain with the problems you’re considering isn’t substantial enough if she spends all her time talking about other problems she has. A failed interview is OK; it may lead you to something even more interesting and save you a lot of heartache.
The more effort the interviewee has put into trying to solve the problems you’re discussing, the better.
Ideally, your interviewees were completely engaged in the process: listening, talking (being animated is a good thing), leaning forward, and so on. After enough interviews you’ll know the difference between someone who’s focused and engaged, and someone who is not.
The goal of the problem interview is to discover a problem painful enough that you know people want it solved. And ideally, the people you’re speaking to are begging you for the solution. The next step in the process is the solution interview, so if you get there with people that’s a good sign.
At the end of every interview, you should be asking for referrals to other interviewees. There’s a good chance the people your subjects recommend are similar in demographics and share the same problems.
The best-case scenario is very high interview scores within a subsection of interviewees where those interviewees all had the same (or very similar) rankings of the problems. That should give you more confidence that you’ve found the right problem and the right market.
The focus now is squarely on retention and engagement. You can look at daily, weekly, and/or monthly active users; how long it takes someone to become inactive; how many inactive users can be reactivated when sent an email; and which features engaged users spend time with, and which they ignore. Segment these metrics by cohort to see if your changes convince additional users to behave differently. Did users who signed up in February stick around longer than those who joined in January?
You don’t just want signs of engagement. You want proof that your product is becoming an integral part of your users’ lives, and that it’ll be hard for them to switch. You’re not looking for, nor should you expect, rapid growth. You’re throwing things at the wall to test stickiness, not measuring how fast you can throw. And by “things,” we mean users. After all, if you can’t convince a hundred users to stick around today, you’re unlikely to convince a million to do so later.
Your top priority is to build a core set of features that gets used regularly and successfully, even by a small group of initial users. Without that, you don’t have a solid enough foundation for growth. Your initial target market can be very small, hyper-focused on the smallest subset of users that you think will generate meaningful results.
Ultimately, you need to prove two things before you can move on to the Virality stage:
Don’t drive new traffic until you know you can turn that extra attention into engagement. When you know users keep coming back, it’s time to grow your user base.
The more engaged that people are with your product (and potentially other users of your product), the more likely they’ll stay. By ignoring growth from virality (for now), you can simplify how you decide what to build next into your MVP. Ask yourself, “Do we believe that the feature we want to build (or the feature we want to change) will improve stickiness?” Put the feature aside if the answer is “no.” But if the answer is “yes,” figure out how to test that belief and start building the feature.
Measuring your viral growth turns out to be really important if you don’t want to pay for customers. The number you’re after is your viral coefficient, which venture capitalist David Skok sums up nicely as “the number of new customers that each existing customer is able to successfully convert.”
To calculate your viral coefficient:
There’s another factor to consider here: cycle time. If it takes only a day for someone to use the site and invite others, you’ll see fast growth. On the other hand, if it takes someone months before she invites others, you’ll see much slower growth.
Cycle time makes a huge difference—so much so, David feels it’s more important than viral coefficient.
Ultimately, what we’re after is a viral coefficient above 1, because this means the product is self-sustaining. With a viral coefficient above 1, every single user is inviting at least another user, and that new user invites another user in turn. That way, after you have some initial users your product grows by itself. In the preceding example, we could do several things to push the viral coefficient toward 1:
Good leading indicators have a few common characteristics:
You find leading indicators by segmentation and cohort analysis. Looking at one group of users who stuck around and another group who didn’t, you might see something they all have in common.
Ask yourself these questions:
At this stage in your startup, you’ve got a product that users like and tell other users about. In the Revenue stage, you need to figure out which “more” increases your revenues per engaged customer the most:
Revenue is not the only financial metric that matters. You want to be breakeven—meaning your revenues exceed your costs on a regular basis.
This means looking at business metrics such as operating costs, marginal costs, and so on. You may discover that it’s a good idea to fire a segment of your customers because of the drain they represent on the business—this is particularly true in B2B startups. With that in mind, here are some possible “gates” you may want to use to decide if you’re ready to move to the Scale stage.
This stage is where you look beyond your own company. If you focus too early on competitors, you can be blinded by what they’re doing, rather than learning what your customers actually need.
In the Scale stage, you want to compare higher-order metrics like Backupify’s OMTM—customer acquisition payback—across channels, regions, and marketing campaigns. For example: is a customer you acquire through channels less valuable than one you acquire yourself? Does it take longer to pay back direct sales or telemarketing? Are international revenues hampered by taxes? These are signs that you won’t be able to scale independent of your own organizational growth.
You never really leave the Scale stage, although as your organization becomes more and more like a “big company” you may find yourself having a hard time innovating. Congratulations—you’re now an intrapreneur, fighting the status quo and trying to change things from within.

Ryan Holiday turned ancient Stoicism into a writing empire: 16 books, 2 million copies sold, and a daily email to 200,000+ subscribers. Here's how he built it.

Discover the 10+ best free AI writing tools for 2026. Compare limits, pricing, and expert insights so you can choose the right writer without paying a cent.

Discover the top 10 invoicing software for freelance writers in 2025, featuring user-friendly tools, pricing details, and key benefits to streamline your invoicing process.
Professional publishing supported by generous companies you should check out.